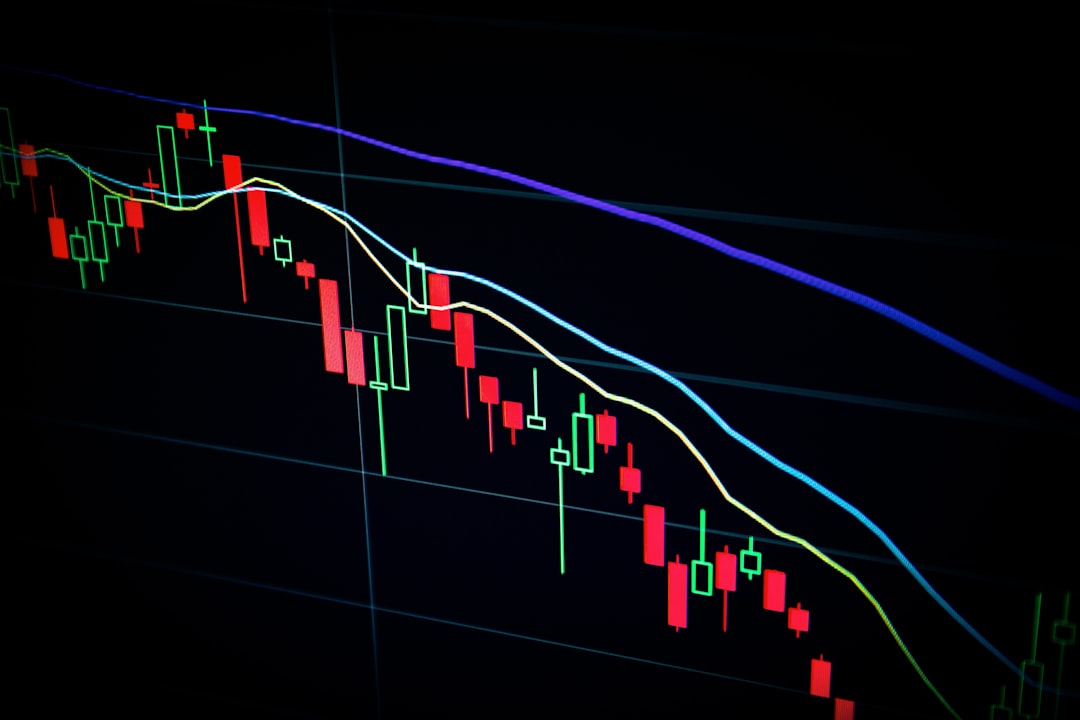
Synthetic financial data has moved from research curiosity to production infrastructure. Banks use it to train fraud models without touching raw cardholder records. Compliance teams share synthetic transaction logs across jurisdictions where GDPR and CCPA would otherwise block data transfers. Regulators are beginning to accept synthetic datasets in supervisory technology pilots. The demand is real, the tooling is maturing, and the deployment pressure is high.
The evaluation practice has not kept pace. Most teams validate synthetic transaction data by checking whether column-level distributions match: does the synthetic dataset reproduce the observed mean transaction amount? Does the categorical frequency of merchant category codes look right? These are marginal distribution tests, and they are dangerously insufficient for synthetic financial data deployed in privacy-sensitive production contexts.
This article lays out why marginal tests fail, what adequate evaluation actually requires, and how engineering and compliance teams can build a gold-standard validation pipeline for synthetic financial data in 2026.
Why Marginal Distribution Tests Fail in Practice
A marginal distribution describes one variable in isolation. A Kolmogorov-Smirnov test comparing synthetic versus real transaction amounts tells you whether the one-dimensional distribution of that column was reproduced. It says nothing about whether the relationship between transaction amount, time-of-day, merchant category, and card-present status was preserved.
Financial fraud patterns live almost entirely in those relationships. A fraudster testing a stolen card at 2 AM with a small-value CNP transaction at a digital goods merchant is not detectable by looking at transaction amount alone. The signal is the joint occurrence of those variables. A synthesizer that produces realistic marginals but destroys the joint structure has generated a dataset that looks statistically clean and is practically useless for fraud model training.
Worse, marginal tests can pass with flying colors on a synthesizer that has memorized training records. Generative Adversarial Networks and diffusion-based tabular synthesizers are capable of near-perfect reconstruction of individual training examples, particularly for rare transaction patterns that appear infrequently in the training data. A KS-test on transaction amount will not surface this memorization. A membership inference attack will.
The financial ML community has been slow to internalize this. Papers published through IEEE Xplore and the ACM Digital Library on tabular GAN evaluation still frequently report only marginal fidelity metrics alongside simple correlation matrices. That evaluation standard is not acceptable for data that carries regulatory privacy obligations under GDPR Article 25, CCPA, or the CFPB's emerging data minimization guidance.
Joint and Temporal Fidelity: What Actually Matters
Joint distribution fidelity measures whether the synthesizer preserved statistical dependencies across multiple variables simultaneously. The practical tools here include mutual information gap metrics, pairwise correlation matrix distance, and maximum mean discrepancy computed in a learned embedding space rather than raw feature space.
Transaction data introduces a third dimension that pure tabular synthesizers routinely fail: time. A cardholder's transaction sequence has Markovian structure. The probability of a transaction at merchant type X is conditioned on the recency and category of prior transactions. Velocity features, which are among the most predictive fraud signals in production systems, are entirely temporal constructs.
Synthesizers that treat each transaction as an independent draw from a joint distribution, which includes most GAN variants based on CTGAN and TVAE architectures, cannot reproduce velocity patterns. The resulting synthetic dataset will fail any evaluation that includes temporal autocorrelation tests or sequence-level KL divergence. More importantly, fraud models trained on that synthetic data will underperform on real transaction streams because the temporal feature distributions have drifted.
Recurrent architectures and transformer-based tabular synthesizers address this partially. But evaluation must explicitly test temporal fidelity. Autocorrelation function comparisons by transaction category, sequence-level earthmover distance, and cardholder-level spending velocity distributions are all measurable and should be reported in any synthetic data quality report.
Membership Inference Attacks Against Financial Synthesizers
Membership inference attacks (MIA) ask a single question: given a data record, can an adversary determine whether that record was part of the synthesizer's training set? For financial transaction data, a successful MIA means that a synthetic dataset leaks the presence of real individuals in the training corpus. This is a privacy violation under GDPR regardless of whether the raw record was directly released.
The shadow model attack framework, formalized in research published on arXiv and at IEEE S&P, is the standard MIA methodology applicable to generative models. An adversary trains multiple shadow synthesizers on datasets of known membership, uses the shadow models to calibrate a membership classifier, and then applies that classifier to the target synthesizer. Attack success is reported as the advantage over random guessing, which should approach zero for a properly privacy-preserving synthesizer.
In practice, GAN-based financial synthesizers are frequently vulnerable. Models trained on imbalanced transaction datasets, where fraudulent transactions are rare, are particularly susceptible. The generator learns to reproduce rare fraud patterns with high fidelity because the discriminator penalizes their absence heavily. Those reproduced patterns are often close to verbatim copies of real training records.
The NIST SP 800-188 guidance on de-identification of government datasets recommends adversarial attack testing as a component of privacy evaluation. Financial institutions subject to GLBA and SOC 2 Type II audits should treat MIA benchmarking as a required control, not an optional research exercise. Any synthetic data vendor that does not publish MIA success rates for their synthesizer should be asked to provide them before procurement.
Differential privacy offers a formal bound on MIA success. A synthesizer trained with (epsilon, delta)-DP guarantees that no adversary can distinguish training set membership with advantage greater than a function of epsilon. Practical epsilon values for financial data depend on the sensitivity of the records, but published guidance from privacy researchers suggests epsilon values above 10.0 provide minimal practical protection against well-resourced adversaries. Teams targeting meaningful privacy protection should aim for epsilon below 3.0, with the understanding that utility costs must be measured explicitly.
Navigating the Privacy-Utility Tradeoff
Differential privacy does not come free. Adding calibrated Gaussian or Laplace noise to synthesizer training via DP-SGD degrades model convergence and reduces the statistical fidelity of the output. This tradeoff is not hypothetical. It is measurable and must be reported.
The tradeoff curve between epsilon and downstream task performance is the most honest representation of what a synthesizer actually delivers. Teams that report only fidelity metrics at a single epsilon value are hiding information that compliance officers and regulators need to make informed decisions about deployment risk.
Building the tradeoff curve requires training the synthesizer at multiple epsilon values, typically spanning the range from 0.5 to 10.0, and measuring both a privacy audit metric (MIA advantage) and a utility metric (fraud detection AUC on held-out real data) at each point. The resulting curve shows where the privacy guarantee becomes meaningful and what utility cost that guarantee extracts.
Published research from groups working on finance-specific DP applications, available through the Bank for International Settlements Innovation Hub and academic preprint servers, consistently shows that the steepest utility degradation occurs below epsilon 1.0. Between epsilon 1.0 and 3.0, many tabular synthesizers retain sufficient utility for downstream fraud model training while providing MIA advantages below 5 percent above chance. This is the practical operating zone for production synthetic financial data in 2026.
Own Your Data's data governance framework at ownmydata.ai addresses how organizations can encode epsilon budget commitments into data access agreements, creating an auditable trail that satisfies both internal risk management and external regulatory review.
Downstream Task Utility as the Real Validity Signal
Fidelity metrics measure how much the synthetic data resembles the real data. Utility metrics measure whether models trained on synthetic data perform on real data. These are related but not equivalent, and the gap between them is where most synthetic data projects fail in production.
The standard utility evaluation for synthetic transaction data is the Train on Synthetic, Test on Real (TSTR) protocol. A fraud detection model is trained exclusively on the synthetic dataset and evaluated on a held-out partition of real transaction records. The resulting AUC, precision-recall curve, and F1 score at the operating threshold are compared against a baseline model trained on real data with the same architecture and hyperparameters.
A TSTR AUC delta below 2 percent relative to the real-data baseline is generally considered acceptable for production use. Deltas above 5 percent indicate that the synthesizer has failed to preserve the fraud-predictive joint structure of the training data, regardless of what the marginal fidelity metrics report.
TSTR should be decomposed by fraud type and transaction channel. CNP fraud, card-present fraud, account takeover patterns, and first-party fraud have different multivariate signatures. A synthesizer might preserve the joint structure for one fraud category while destroying it for another. Aggregate TSTR AUC masks these failures. Stratified TSTR by fraud typology is the correct evaluation design.
Teams using synthetic data for model training under SR 11-7 model risk management guidance should include TSTR results in their model documentation. Validators reviewing synthetic-data-trained models should request stratified TSTR reports as a standard part of the model validation package.
A Gold-Standard Evaluation Framework for 2026
Pulling these threads together, a production-grade evaluation framework for synthetic financial data requires six components reported together as a single validation artifact.
Component 1: Marginal and Pairwise Fidelity. KS-tests on continuous variables, chi-squared tests on categoricals, pairwise correlation matrix distance. These are necessary baselines, not sufficient conclusions. Report them with their limitations acknowledged.
Component 2: Joint Distribution Fidelity. Maximum mean discrepancy in a learned embedding space, mutual information gap across variable pairs, and propensity score classifier AUC measuring whether a classifier can distinguish real from synthetic records. A propensity AUC below 0.55 indicates good joint fidelity.
Component 3: Temporal Sequence Fidelity. Autocorrelation function comparison by transaction category, cardholder-level velocity distribution distance, sequence-level earthmover distance for transaction type transitions. Required for any synthesizer used to train models with sequence or velocity features.
Component 4: Privacy Audit via Membership Inference. Shadow model MIA with reported attack advantage over chance. DP epsilon accounting if the synthesizer was trained with formal DP guarantees. Any synthesizer deployed in a GDPR or CCPA context without a reported MIA result has not been adequately validated.
Component 5: TSTR Utility Benchmarks. Stratified by fraud typology and transaction channel. Report AUC delta versus real-data baseline with confidence intervals. Include precision-recall curve comparison at the production operating threshold.
Component 6: Privacy-Utility Tradeoff Curve. MIA advantage and TSTR AUC plotted across the epsilon range used during training. This curve is the evidence base for epsilon selection decisions and should be retained as a compliance artifact.
Implementation tooling for this framework exists. The Synthetic Data Vault library supports marginal and pairwise fidelity reporting. The SDMetrics library provides propensity score evaluation. MIA tooling is available through academic repositories linked from arXiv papers on generative model auditing. DP accounting is available through Google's DP library and OpenDP. Integration of these tools into a unified evaluation pipeline is an engineering task, not a research problem.
For teams building consent-based synthetic data sharing pipelines, mydatakey.org provides implementation references for data product agreements that encode evaluation requirements into the terms of synthetic data access, ensuring downstream consumers receive the full validation artifact rather than a marketing summary.
The financial data infrastructure community has built sophisticated synthesizers. The next maturity step is building equally sophisticated evaluation pipelines that treat privacy as a measurable property, not a narrative claim. Marginal distribution matching was a starting point. It is not a destination.